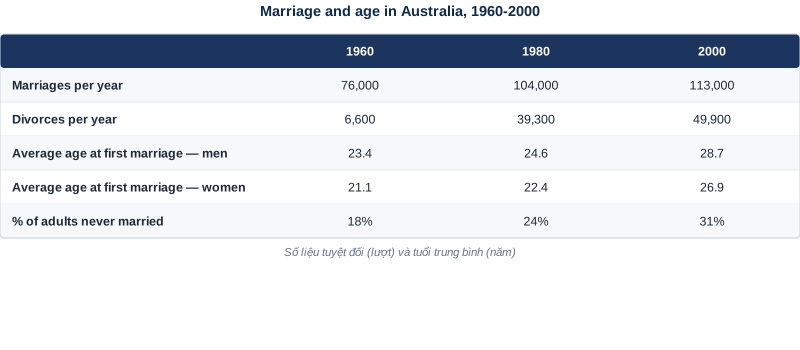
Table — Marriage, divorce and age at first marriage in Australia, 1960-2000
📄 Bài mẫu band 8–9
| Introduction | Paraphrase: tình hình kết hôn và tuổi kết hôn ở Úc, 1960-2000. |
| Overview | Overall: người Úc kết hôn muộn hơn và ly hôn nhiều hơn theo thời gian, đồng thời tỷ lệ chưa từng kết hôn tăng đều. Không số liệu. |
| Body 1 | Kết hôn 76.000 → 113.000 lượt/năm; ly hôn 6.600 → 49.900 lượt/năm, tăng gần 8 lần — nhanh hơn hẳn. |
| Body 2 | Tuổi kết hôn lần đầu: nam 23,4 → 28,7; nữ 21,1 → 26,9 (nữ luôn trẻ hơn khoảng 2 tuổi); chưa từng kết hôn 18% → 31%. |
The table presents information about marriage, divorce and the age at which Australians first married in 1960, 1980 and 2000.
Overall, Australians came to marry later in life and to divorce far more frequently over these four decades, and a growing minority never married at all. Divorce increased much faster than marriage itself.
The number of weddings grew steadily but modestly, from 76,000 a year in 1960 to 104,000 in 1980 and 113,000 in 2000, an overall rise of roughly 50%. Divorces followed a far steeper path: from only 6,600 cases in 1960 the figure rose eightfold to 49,900 by 2000. As a result there were fewer than nine marriages for every divorce in 2000, compared with more than eleven to one forty years earlier.
The age data point in the same direction. Men married for the first time at an average age of 23.4 in 1960 but at 28.7 in 2000, while the figure for women rose from 21.1 to 26.9. The age gap between the sexes therefore held constant at roughly two years, with women always the younger partners. Meanwhile the share of adults who remained single climbed from 18% to 31%, a rise of thirteen percentage points.
| marry later in life | kết hôn muộn hơn |
| an overall rise of | mức tăng chung là |
| rose eightfold | tăng gấp tám lần |
| The age gap | khoảng cách tuổi |
| held constant | giữ nguyên không đổi |
| remained single | vẫn độc thân |
| a rise of thirteen percentage points | mức tăng 13 điểm phần trăm |