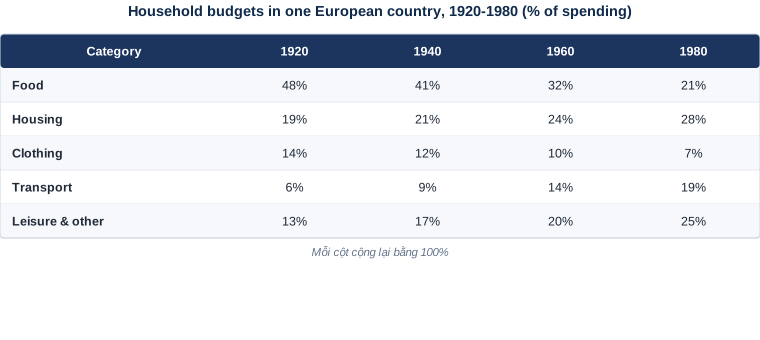
Table — Household budgets in one European country, 1920-1980
📄 Bài mẫu band 8–9
| Introduction | Paraphrase: cơ cấu chi tiêu hộ gia đình ở một nước châu Âu, 1920-1980. |
| Overview | Overall: tỷ trọng chi cho nhu cầu thiết yếu giảm mạnh, nhường chỗ cho nhà ở, đi lại và giải trí — dấu hiệu mức sống tăng lên. Không số liệu. |
| Body 1 | Thực phẩm 48% → 21% (mất hơn một nửa, từ khoản lớn nhất xuống hạng ba); quần áo 14% → 7%, giảm một nửa. |
| Body 2 | Nhà ở 19% → 28% (khoản lớn nhất năm 1980); giao thông 6% → 19%, hơn gấp ba; giải trí 13% → 25%. |
The table shows how households in one European country divided their spending between five categories at twenty-year intervals from 1920 to 1980.
Overall, essentials absorbed a shrinking share of the household budget across the period, while housing, transport and leisure all claimed progressively more. The category that dominated spending in 1920 had been overtaken twice by the end.
Food was easily the largest item in 1920, taking 48% of household expenditure, but its share fell at every measurement, to 41%, then 32% and finally 21% in 1980. It therefore lost more than half of its original weight and was overtaken by both housing and leisure. Clothing followed the same downward path on a smaller scale, halving from 14% to 7% and remaining the smallest category throughout.
The money freed up went elsewhere. Housing rose steadily from 19% to 28%, making it the biggest single item by 1980. Transport recorded the sharpest proportional growth, more than tripling from 6% to 19%, and discretionary spending on leisure and other goods climbed from 13% to 25%. By the end of the period these three categories together accounted for almost three quarters of all household spending.
| essentials | các nhu yếu phẩm |
| a shrinking share | một tỷ trọng ngày càng nhỏ |
| was overtaken by | bị vượt qua bởi |
| freed up | được giải phóng ra |
| more than tripling | tăng hơn gấp ba |
| discretionary spending | chi tiêu tuỳ ý (không bắt buộc) |