Table — Exchange students between European universities and Australia, 2005-2023
📄 Bài mẫu band 8–9
| Introduction | Paraphrase: số sinh viên trao đổi giữa các trường đại học châu Âu và Úc theo hai chiều, 2005-2023. |
| Overview | Overall: số sinh viên trao đổi tăng rõ rệt ở cả hai chiều nhưng có một năm sụt sâu; luồng từ châu Âu sang Úc luôn đông hơn chiều ngược lại. Không số liệu. |
| Body 1 | Châu Âu → Úc: 2.140 → 5.120 (2015), sụt còn 3.260 (2020) rồi lên đỉnh 6.050 (2023). |
| Body 2 | Úc → châu Âu: 1.760 → 2.240, sụt còn 1.180 (2020) rồi phục hồi lên 2.910; tổng 3.900 → 8.960. |
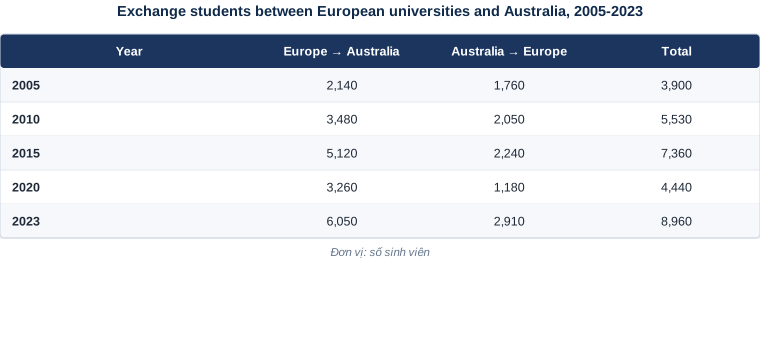
The table shows how many exchange students travelled from European universities to Australia, and from Australia to Europe, in five selected years between 2005 and 2023.
Overall, student exchange grew substantially in both directions over the period, although the figures slumped sharply in 2020 before recovering. Europeans travelling to Australia consistently outnumbered those making the journey the other way.
The flow from Europe to Australia was always the larger of the two. It rose from 2,140 students in 2005 to 3,480 in 2010 and 5,120 in 2015, then fell by more than a third to 3,260 in 2020. The figure recovered strongly thereafter, reaching an all-time high of 6,050 in 2023, almost three times the number recorded at the start.
Australian students going to Europe followed the same shape but on a much smaller scale, edging up from 1,760 to 2,240 between 2005 and 2015 before dropping to just 1,180 in 2020, the lowest figure in the table. By 2023 numbers had climbed to 2,910. Total exchanges therefore more than doubled across the period, from 3,900 to 8,960, with Europe sending roughly twice as many students as it received in the final year.
| in both directions | theo cả hai chiều |
| slumped | sụt mạnh |
| outnumbered | đông hơn về số lượng |
| recovered strongly | phục hồi mạnh |
| an all-time high | mức cao nhất từ trước tới nay |
| the lowest figure in the table | con số thấp nhất trong bảng |
| roughly twice as many | nhiều hơn khoảng gấp đôi |