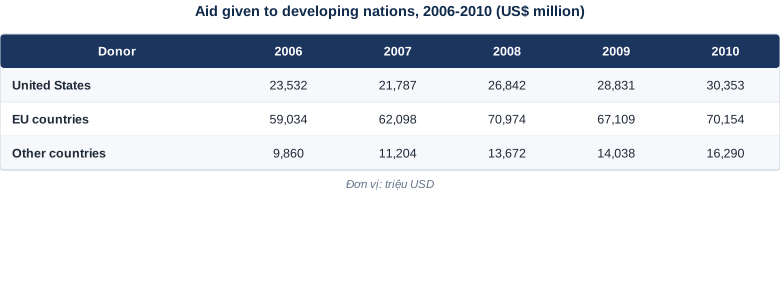
Table — Money donated to developing nations by the USA, EU countries and others, 2006-2010
📄 Bài mẫu band 8–9
| Introduction | Paraphrase: số tiền viện trợ cho các nước đang phát triển từ Mỹ, các nước EU và nhóm còn lại, 2006-2010, triệu USD. |
| Overview | Overall: cả ba nguồn đều viện trợ nhiều hơn vào cuối kỳ; EU luôn là nhà tài trợ lớn nhất với khoảng cách rất xa. Không số liệu. |
| Body 1 | EU khoảng 59 tỷ → 71 tỷ USD, đỉnh năm 2008, hụt xuống 67 tỷ năm 2009 rồi hồi phục. |
| Body 2 | Mỹ 23,5 tỷ → 30,4 tỷ (tăng đều từ 2008); nhóm khác 9,9 tỷ → 16,3 tỷ, tăng khoảng 65% — nhanh nhất theo tỷ lệ. |
The table compares the value of aid, in millions of US dollars, given to developing nations by the United States, the countries of the European Union and other donors in each year from 2006 to 2010.
Overall, all three donor groups gave more in 2010 than in 2006. The European Union contributed by far the largest sums throughout, while the smaller donors grew fastest in relative terms.
EU aid was more than twice the American figure in every year. It rose from roughly 59 billion dollars in 2006 to a peak of almost 71 billion in 2008, then dipped to 67 billion in 2009 before rebounding to just over 70 billion. This was the only category to fall at any point in the period.
The United States and the remaining donors both increased their contributions without interruption after 2007. American aid fell slightly in 2007, to 21.8 billion dollars, but then climbed each year to reach 30.4 billion in 2010, a gain of almost a third on the opening figure. Aid from other countries, though the smallest in absolute terms, grew from 9.9 to 16.3 billion dollars, an increase of about 65% — the fastest growth in relative terms of the three groups.
| donor | nhà tài trợ |
| dipped | hụt xuống |
| rebounding | bật lại |
| a gain of almost a third | mức tăng gần một phần ba |
| in absolute terms | xét theo giá trị tuyệt đối |
| the fastest growth in relative terms | mức tăng nhanh nhất xét theo tỷ lệ |