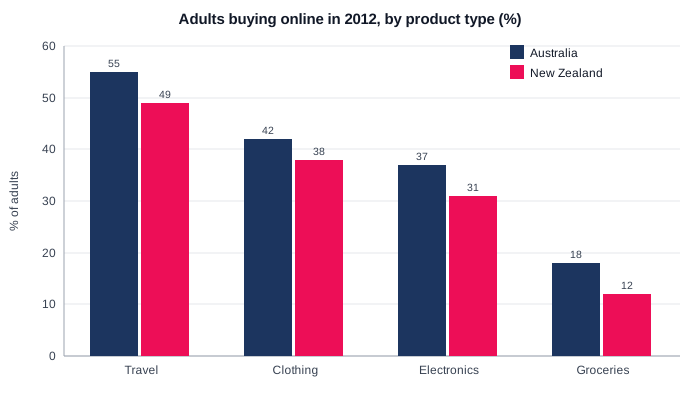
Bar chart — Adults who bought four types of products online in Australia and New Zealand, 2012
📄 Bài mẫu band 8–9
| Introduction | Paraphrase: biểu đồ tỉ lệ người trưởng thành mua 4 nhóm hàng online tại Úc và New Zealand năm 2012. |
| Overview | Overall: trật tự 4 nhóm giống hệt nhau ở hai nước (du lịch nhiều nhất, thực phẩm ít nhất) và Úc cao hơn New Zealand ở cả 4 nhóm, chênh nhất ở nhóm thực phẩm (18 vs 12 — hơn gấp rưỡi). |
| Body 1 | Nhóm cao: du lịch 55% (Úc) vs 49% (NZ) — nhóm duy nhất chạm ~1/2 dân số trưởng thành; quần áo 42 vs 38. |
| Body 2 | Nhóm thấp: đồ điện tử 37 vs 31; thực phẩm chỉ 18 vs 12 — chưa bằng 1/3 nhóm du lịch; chênh lệch hai nước 4–6 điểm ở mọi nhóm. |
The bar chart compares the percentage of adults in Australia and New Zealand who purchased four categories of products online in 2012.
Overall, the two countries showed an identical ranking: travel was the most commonly bought category online and groceries much the least popular. Australians, moreover, out-shopped New Zealanders across all four categories, with the widest relative gap in groceries.
Travel products were clearly the leaders. Some 55 per cent of Australian adults booked travel online in 2012 — more than half the adult population — compared with 49 per cent of New Zealanders. Clothing came second in both countries, purchased online by 42 per cent of Australians and 38 per cent of their neighbours.
The remaining categories attracted noticeably fewer buyers. Electronics were bought online by 37 per cent of adults in Australia but barely three in ten in New Zealand. Groceries, meanwhile, lagged far behind everything else: only 18 per cent of Australians and 12 per cent of New Zealanders shopped for food online, less than a third of the equivalent figures for travel. Across the chart, the gap between the two countries stayed within a narrow band of four to six percentage points, but because the groceries figures were so small, Australia's lead there was proportionally the largest — half as much again as New Zealand's rate.
| an identical ranking | thứ hạng giống hệt nhau |
| out-shopped | mua nhiều hơn |
| across all four categories | ở cả bốn nhóm hàng |
| more than half | hơn một nửa |
| barely three in ten | chỉ vỏn vẹn 3 trên 10 |
| lagged far behind | tụt lại xa phía sau |
| less than a third | chưa bằng một phần ba |
| narrow band | biên độ hẹp |