Bar chart — How people in London travelled to work, 2000 and 2020
📄 Bài mẫu band 8–9
| Introduction | Paraphrase: biểu đồ cho biết tỉ lệ người lao động ở London dùng bốn phương thức đi làm năm 2000 và 2020. |
| Overview | Overall: ô tô mất ngôi đầu vào tay phương tiện công cộng; xe đạp tăng vọt; đi bộ gần như không đổi. |
| Body 1 | Ô tô 41%→24% (mất 17 điểm, mức giảm lớn nhất); phương tiện công cộng 38%→45%, thành lựa chọn phổ biến nhất. |
| Body 2 | Xe đạp 5%→17%, tăng hơn ba lần — phần lớn số người rời bỏ ô tô chuyển sang hai nhóm này; đi bộ 16%→14%. |
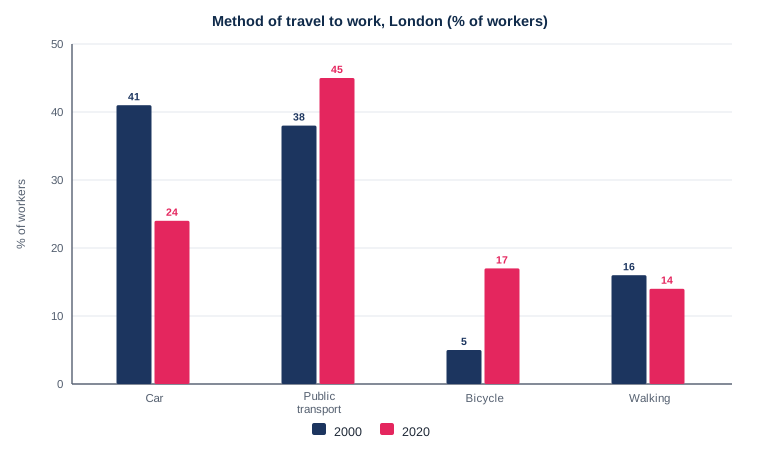
The bar chart compares the percentage of London workers using four different ways of getting to work in 2000 and 2020.
Overall, the car lost its dominant position over the twenty years, while public transport and, more dramatically, cycling gained ground. Walking was the only mode that stayed roughly constant.
In 2000 the car was the most common choice, used by 41 per cent of workers, with public transport close behind on 38 per cent. Twenty years later these positions had been reversed: car use had fallen by 17 percentage points to 24 per cent, the steepest fall of any mode, while public transport had risen to 45 per cent and become the clear leader.
Cycling showed the largest change in relative terms, more than tripling from 5 to 17 per cent. Walking, by contrast, held steady, slipping only from 16 to 14 per cent. Since the four figures must total 100 per cent, the 17 points given up by drivers were absorbed almost entirely by public transport and bicycles.
| getting to work | đi làm |
| lost its dominant position | mất vị thế thống trị |
| gained ground | giành thêm chỗ đứng |
| reversed | đảo ngược |
| the steepest fall of any mode | mức giảm mạnh nhất trong các phương thức |
| in relative terms | xét theo tỉ lệ |
| more than tripling | tăng hơn gấp ba |
| held steady | giữ nguyên |
| must total 100 per cent | buộc phải cộng lại thành 100% |