Pie charts — Household expenditure on goods and services, 1995 and 2005
📄 Bài mẫu band 8–9
| Introduction | Paraphrase: hai biểu đồ tròn cho biết tỉ lệ chi tiêu hộ gia đình theo sáu nhóm hàng hoá và dịch vụ năm 1995 và 2005. |
| Overview | Overall: ăn uống mất ngôi khoản chi lớn nhất vào tay nhà ở và nhiên liệu; đi lại tăng rõ; ba nhóm còn lại gần như đứng yên. |
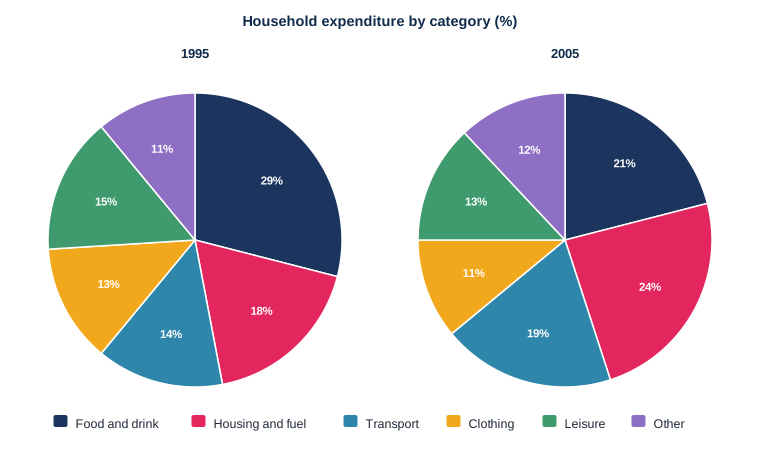
| Body 1 | Nhóm đổi mạnh: food 29%→21% (giảm 8 điểm), housing 18%→24%, transport 14%→19%. |
| Body 2 | Nhóm ổn định: clothing 13%→11%, leisure 15%→13%, other 11%→12% — biến động tối đa 2 điểm phần trăm. |
The two pie charts compare the proportion of household expenditure devoted to six categories of goods and services in one country in 1995 and 2005.
Overall, the pattern of spending shifted noticeably over the decade: food and drink lost its position as the largest single item to housing and fuel, and transport also took a larger share, while the remaining categories were broadly unchanged.
The clearest movement was in food and drink, which fell from 29 per cent of the household budget to 21 per cent, a drop of eight percentage points. Housing and fuel moved in the opposite direction, rising from 18 to 24 per cent and becoming the biggest expense by 2005. Transport followed the same upward path, up from 14 to 19 per cent.
The other three categories barely moved. Spending on leisure edged down from 15 to 13 per cent and clothing from 13 to 11, while the residual category rose marginally from 11 to 12 per cent. Taken together, these three accounted for 39 per cent of the budget in 1995 and 36 per cent ten years later.
| proportion of household expenditure | tỉ trọng chi tiêu hộ gia đình |
| shifted noticeably | dịch chuyển rõ rệt |
| took a larger share | chiếm tỉ trọng lớn hơn |
| broadly unchanged | về cơ bản không đổi |
| a drop of eight percentage points | giảm tám điểm phần trăm |
| barely moved | gần như không nhúc nhích |
| Taken together | gộp lại |