Pie charts — Household energy use in Australia, 1995 and 2015
📄 Bài mẫu band 8–9
| Introduction | Paraphrase: hai biểu đồ tròn cho biết cách một hộ gia đình Úc trung bình sử dụng năng lượng năm 1995 và 2015. |
| Overview | Overall: sưởi ấm vẫn là khoản lớn nhất nhưng co lại; nhóm thiết bị gia dụng khác tăng hơn gấp đôi và vươn lên hạng hai. |
| Body 1 | Bốn nhóm giảm: space heating 42%→33%, water heating 27%→24%, refrigeration 9%→7%, lighting 8%→5%. |
| Body 2 | Other appliances 14%→31%, tăng 17 điểm — vượt water heating để thành nhóm lớn thứ hai. |
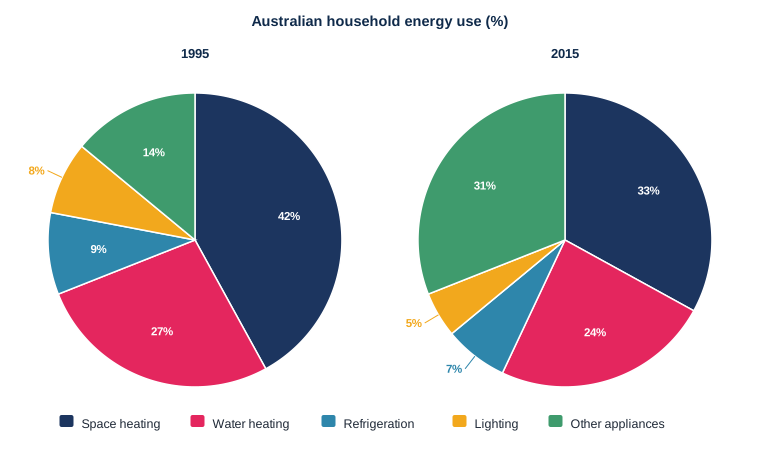
The two pie charts show how energy was used by an average Australian household in 1995 and in 2015.
Overall, space heating remained the single largest use of energy in both years, but its share contracted markedly. The most striking development was the growth of other appliances, which more than doubled its share and rose from fourth place to second.
In 1995 heating accounted for the bulk of household energy: space heating took 42 per cent and water heating a further 27, so that the two combined made up more than two-thirds of the total. Refrigeration and lighting were minor items, at 9 and 8 per cent respectively.
Twenty years later every one of these four categories had shrunk. Space heating fell to 33 per cent, water heating to 24, refrigeration to 7 and lighting to 5 — the last of these almost halving. The share taken by other appliances, meanwhile, jumped from 14 to 31 per cent, an increase of 17 percentage points, leaving it just two points behind space heating and comfortably ahead of water heating.
| contracted markedly | co lại rõ rệt |
| more than doubled | tăng hơn gấp đôi |
| accounted for the bulk | chiếm phần lớn |
| the two combined | cả hai cộng lại |
| minor items | các khoản nhỏ |
| almost halving | giảm gần một nửa |
| an increase of 17 percentage points | tăng 17 điểm phần trăm |