Pie chart — Share of the world's forests and of world timber production, by region
📄 Bài mẫu band 8–9
| Introduction | Paraphrase: tỷ trọng diện tích rừng thế giới và tỷ trọng sản lượng gỗ thế giới theo 5 khu vực. |
| Overview | Overall: hai cơ cấu lệch nhau rõ rệt — có khu vực nhiều rừng mà ít gỗ, có khu vực ít rừng mà nhiều gỗ. Không số liệu. |
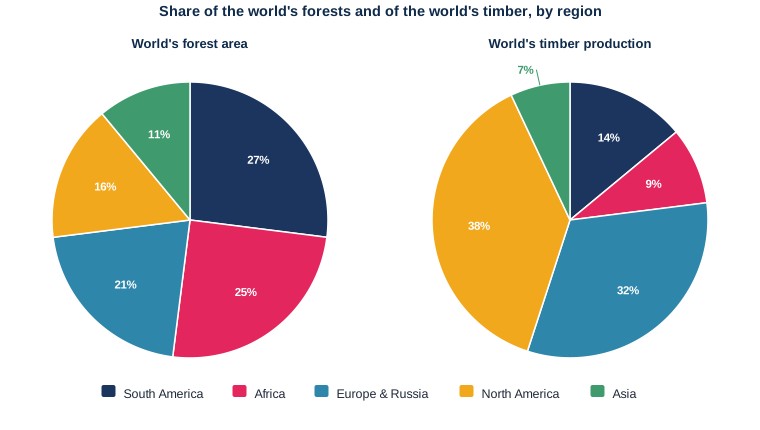
| Body 1 | Nam Mỹ 27% rừng nhưng chỉ 14% gỗ; châu Phi 25% rừng nhưng 9% gỗ — chênh lệch lớn nhất bảng. |
| Body 2 | Bắc Mỹ 16% rừng nhưng 38% gỗ; châu Âu & Nga 21% rừng và 32% gỗ; châu Á 11% rừng và 7% gỗ, gần cân đối nhất. |
The two pie charts compare how the world's forest area is distributed between five regions with the share of global timber production that each region accounts for.
Overall, there is a striking mismatch between where forests are located and where timber is actually produced. The two regions with the largest forest areas contribute relatively little timber, whereas North America produces disproportionately more than its forest cover would suggest.
South America is home to the greatest share of the world's forests, at 27%, yet it accounts for only 14% of timber production, roughly half of what its forest area implies. The imbalance is even sharper in Africa, which holds a quarter of global forest cover but supplies just 9% of the world's timber, the smallest production share of any region despite ranking second for forest area.
The reverse is true elsewhere. North America has the second smallest forest area, at 16%, but punches above its weight to produce 38% of the world's timber, more than any other region. Europe and Russia show a milder version of the same pattern, with 21% of forests and 32% of production. Only Asia's two shares are roughly matched, at 11% and 7% respectively.
| mismatch between | sự lệch pha giữa |
| disproportionately | một cách không tương xứng |
| is home to | là nơi có, chứa đựng |
| the smallest production share | tỷ trọng sản xuất nhỏ nhất |
| punches above its weight | làm được nhiều hơn tầm vóc của mình |
| a milder version of | một phiên bản nhẹ hơn của |
| roughly matched | gần khớp nhau |