Pie chart — How students travelled to a university campus, 2015 and 2019
📄 Bài mẫu band 8–9
| Introduction | Paraphrase: phương tiện sinh viên dùng để tới một khuôn viên đại học, 2015 và 2019. |
| Overview | Overall: sinh viên chuyển từ ô tô cá nhân sang phương tiện công cộng và xe đạp, khiến xe buýt trở thành cách đi phổ biến nhất. Không số liệu. |
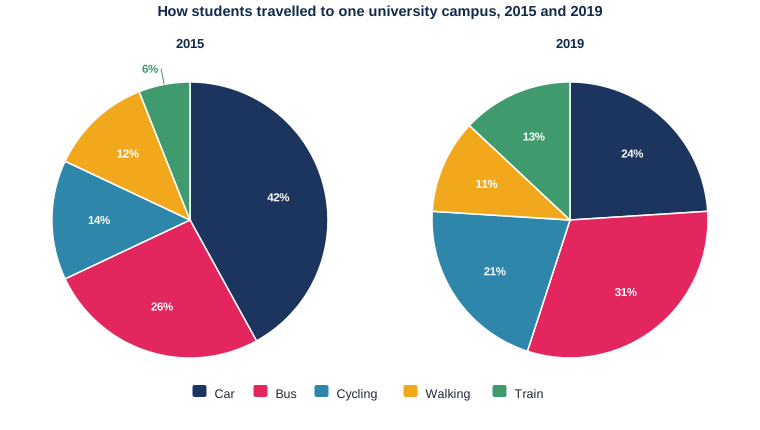
| Body 1 | Ô tô 42% → 24% (mất gần một nửa tỷ trọng); xe buýt 26% → 31%, vươn lên dẫn đầu. |
| Body 2 | Xe đạp 14% → 21%; tàu 6% → 13% (hơn gấp đôi); đi bộ 12% → 11%, gần như không đổi. |
The two pie charts compare the means of transport used by students to reach one university campus in 2015 and 2019.
Overall, the car gave way to public transport and cycling over the four-year period, so that buses became the most popular means of transport by the end. Walking was the only category that barely changed.
The car was the dominant choice in 2015, used by 42% of students, well ahead of the 26% who travelled by bus. By 2019 its share had fallen to 24%, a loss of eighteen percentage points, and it had been overtaken by the bus, which rose to 31%. These two categories effectively exchanged positions in the space of four years.
The remaining sustainable modes all became more common. Cycling grew from 14% to 21% of journeys, and rail travel more than doubled, from 6% to 13%, making it the fastest-growing option in proportional terms even though it stayed the smallest. Walking recorded a marginal fall from 12% to 11%. Taken together, cycling, walking and public transport carried about three quarters of students in 2019, compared with well under three fifths four years earlier.
| gave way to | nhường chỗ cho |
| the most popular means of transport | phương tiện phổ biến nhất |
| exchanged positions | đổi vị trí cho nhau |
| sustainable modes | các phương thức di chuyển bền vững |
| more than doubled | hơn gấp đôi |
| a marginal fall | mức giảm không đáng kể |
| well under three fifths | thấp hơn ba phần năm khá nhiều |