Mixed charts — Life expectancy in four countries: by sex in 2008 and change since 1953
📄 Bài mẫu band 8–9
| Introduction | Paraphrase gộp cả hai hình: tuổi thọ theo giới năm 2008 và thay đổi tuổi thọ 1953-2008 ở 4 quốc gia. |
| Overview | Overall: nữ sống lâu hơn nam ở cả bốn nước, và những nước có tuổi thọ thấp nhất năm 1953 lại tăng nhiều nhất nên khoảng cách giữa các nước thu hẹp. Không số liệu. |
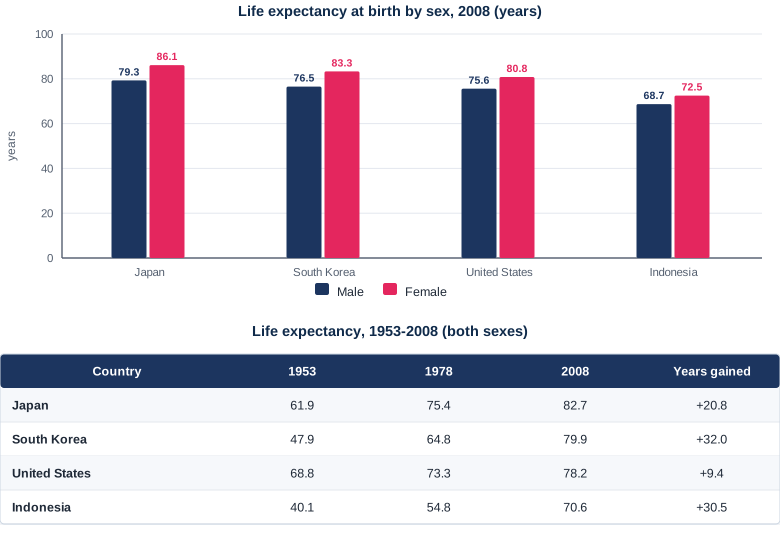
| Body 1 | Biểu đồ cột 2008: Nhật cao nhất (nam 79,3 - nữ 86,1); Indonesia thấp nhất (68,7 - 72,5); chênh lệch giới lớn nhất ở Nhật (6,8 năm), nhỏ nhất ở Indonesia (3,8 năm). |
| Body 2 | Bảng: Hàn Quốc +32,0 năm và Indonesia +30,5 năm (xuất phát thấp nhất); Mỹ chỉ +9,4 năm dù dẫn đầu năm 1953. |
The bar chart shows how long men and women could expect to live in four countries in 2008, while the table records how life expectancy in those countries changed between 1953 and 2008.
Overall, women outlive men in every country shown, and the nations that started with the lowest life expectancy have improved most, so the four countries have converged considerably over the fifty-five years.
In 2008 Japan led on both measures, with men living 79.3 years on average and women 86.1. South Korea and the United States were close behind for men, at 76.5 and 75.6 years, while Indonesia trailed at 68.7. The female advantage was clear everywhere but varied in size: it reached a gender gap of 6.8 years in Japan yet only 3.8 years in Indonesia, the narrowest in the chart.
The table explains how these positions were reached. South Korea gained the most years, adding 32.0 to a 1953 figure of just 47.9, and Indonesia was not far behind with 30.5 years added from the lowest base of all. The United States, which led in 1953 at 68.8 years, improved by only 9.4 years and consequently slipped to third place, overtaken by both Japan and South Korea.
| outlive | sống lâu hơn |
| converged | hội tụ lại gần nhau |
| a gender gap of | khoảng cách giới là |
| gained the most years | tăng thêm nhiều năm nhất |
| from the lowest base | từ mức nền thấp nhất |
| slipped to third place | tụt xuống vị trí thứ ba |