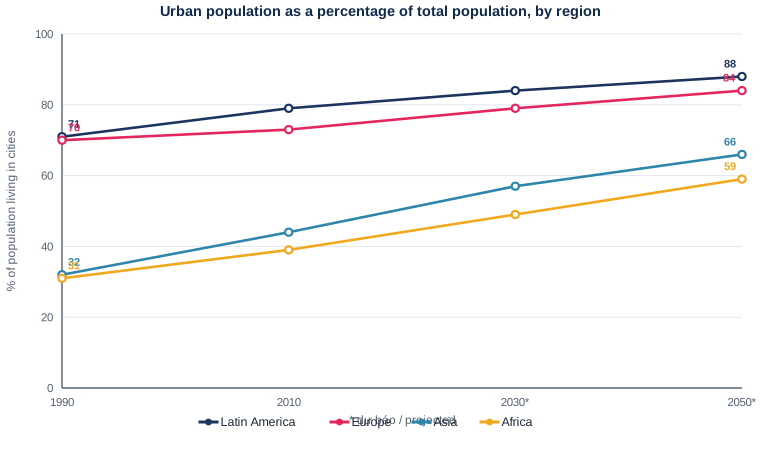
Line graph — Urban population by world region, 1990-2050 (with projections)
📄 Bài mẫu band 8–9
| Introduction | Paraphrase: tỷ lệ dân đô thị ở 4 khu vực, 1990-2050, có dự báo. |
| Overview | Overall: cả 4 khu vực đều đô thị hoá thêm; nhóm xuất phát thấp tăng nhanh hơn nên khoảng cách thu hẹp. Không số liệu. |
| Body 1 | Mỹ Latinh 71% → 88% (luôn cao nhất); châu Âu 70% → 84%, tăng chậm ở giai đoạn đầu rồi nhanh hơn. |
| Body 2 | Châu Á 32% → 66% (tăng mạnh nhất, hơn gấp đôi); châu Phi 31% → 59%, luôn thấp nhất nhưng thu hẹp khoảng cách. |
The line graph illustrates the proportion of people living in urban areas in four world regions between 1990 and 2050, with the final two figures being projections.
Overall, urbanisation is expected to increase in every region across the period. The two regions that were already highly urbanised in 1990 will continue to lead, but the developing regions are growing at a far steeper rate, so the gap between them narrows considerably.
Latin America had the highest level of urbanisation in 1990, at 71%, and is projected to reach 88% by 2050. Europe followed an almost identical path, starting at 70% and rising more slowly at first, to 73% in 2010, before it is expected to accelerate to 84% by the end of the period. Neither region ever dips below the two-thirds mark.
Asia and Africa began from a much lower base, with roughly a third of their populations in cities in 1990. Asia's urban share is forecast to more than double, from 32% to 66%, and it should pass the halfway point shortly after 2030. Africa, which trails throughout, is projected to climb from 31% to 59%, narrowing the distance to Asia to only seven percentage points.
| the gap between them narrows | khoảng cách giữa hai bên thu hẹp |
| is projected to reach | được dự báo đạt tới |
| is expected to accelerate | được kỳ vọng sẽ tăng tốc |
| dips below | tụt xuống dưới |
| from a much lower base | từ một mức nền thấp hơn hẳn |
| more than double | hơn gấp đôi |
| trails throughout | bám sau suốt cả kỳ |