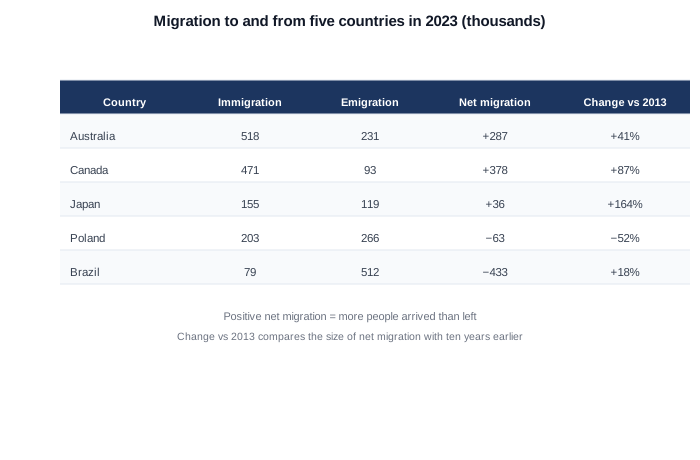
Table — Migration to and from five countries in 2023
📄 Bài mẫu band 8–9
| Introduction | Paraphrase: bảng nhập cư, xuất cư và di cư ròng của 5 nước năm 2023, kèm so sánh với 2013. |
| Overview | Overall: chia 2 nhóm rõ — Úc, Canada, Nhật nhận ròng; Ba Lan, Brazil mất ròng; Canada nhận ròng lớn nhất (+378 nghìn), Brazil mất nặng nhất (−433 nghìn); cột thay đổi 10 năm phải đọc thận trọng vì nó phóng đại các nền thấp. |
| Body 1 | Nhóm nhận: Canada +378 (tăng 87% so 2013) dù nhập cư ít hơn Úc — vì xuất cư rất thấp (93 nghìn); Úc +287; Nhật chỉ +36 nhưng 'tăng 164%' — nền 2013 rất nhỏ. |
| Body 2 | Nhóm mất: Ba Lan −63 và đang co lại (−52%); Brazil −433, dòng mất còn phình thêm 18% — xuất cư 512 nghìn gấp 6,5 lần nhập cư. |
The table compares immigration, emigration and net migration for five countries in 2023, together with how the net figure had changed since 2013.
Overall, the countries divide into net receivers — Australia, Canada and Japan — and net losers — Poland and Brazil. Canada gained the most people overall, Brazil lost by far the most, and the percentage-change column rewards careful reading, since it magnifies movements from a small base.
Among the receivers, Canada''s net gain of +378,000 was the largest in the table, achieved not through the highest immigration (Australia''s 518,000 exceeded Canada''s 471,000) but through strikingly low emigration of just 93,000. Australia netted +287,000. Japan''s net gain was modest at +36,000, yet its change figure — +164 per cent — was the biggest of all, simply because its 2013 base was tiny.
The losers differ in direction as well as size. Poland''s net loss of 63,000 was barely half what it had been a decade earlier. Brazil, in contrast, saw 512,000 people leave against only 79,000 arrivals — a net loss of 433,000 that had actually grown by 18 per cent since 2013, making it the one country in the table whose outflow was still accelerating.
| net receivers | nhóm nhận ròng |
| net losers | nhóm mất ròng |
| rewards careful reading | phải đọc kỹ mới đúng |
| +378,000 | +378 nghìn |
| low emigration | xuất cư thấp |
| +164 per cent | +164% |
| barely half | chỉ còn phân nửa |
| 433,000 | 433 nghìn |
| grown by 18 per cent | phình thêm 18% |