Line + table — Internet use by age group in Norlandia, 2005–2025
📄 Bài mẫu band 8–9
| Introduction | Paraphrase: biểu đồ 3 nhóm tuổi dùng internet hằng ngày 2005–2025 + bảng nêu bật nhóm 65+. |
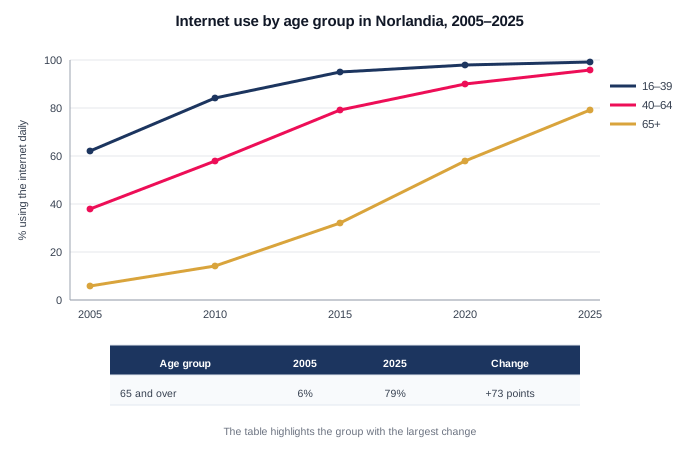
| Overall | Overall: cả 3 nhóm cùng tăng và HỘI TỤ — nhóm trẻ chạm trần ~99% từ sớm, nhóm 65+ xuất phát gần 0 nhưng tăng mạnh nhất (+73 điểm), thu hẹp khoảng cách thế hệ từ 56 điểm (2005) còn 20 điểm (2025). |
| Body 1 | 16–39: 62% → 95% (2015) rồi kịch trần 99%; 40–64: 38% → 96%, gần bắt kịp nhóm trẻ từ 2020. |
| Body 2 | 65+: 6% (2005) → 32% (2015) → 79% (2025); bảng chốt +73 điểm — mức thay đổi lớn nhất; khoảng cách với nhóm trẻ giờ chỉ 20 điểm. |
The graph tracks daily internet use across three age groups in Norlandia from 2005 to 2025, and the accompanying table singles out the oldest group''s change.
Overall, all three groups rose and steadily converged: the youngest reached saturation early, the middle group caught up by 2020, and the over-65s — the focus of the table — recorded much the largest increase, cutting the generational gap from 56 percentage points to just 20.
The 16–39 group began highest at 62 per cent, passed 95 per cent by 2015 and then flattened at 99 per cent, an effective ceiling. Those aged 40–64 followed the same curve a few years behind, climbing from 38 to 96 per cent and drawing level with the young for practical purposes by 2020.
The over-65s tell the real story. Only 6 per cent used the internet daily in 2005; the figure then accelerated decade by decade — 32 per cent in 2015, 58 in 2020 — to reach 79 per cent in 2025. That is the +73-point change the table highlights, and it means the online gap between Norlandia''s oldest and youngest adults, once a chasm, is now a matter of twenty points and closing.
| converged | hội tụ |
| saturation | mức bão hoà |
| much the largest increase | mức tăng lớn nhất rõ rệt |
| 99 per cent | 99% |
| 96 per cent | 96% |
| 6 per cent | 6% |
| 79 per cent in 2025 | 79% vào 2025 |
| +73-point change | thay đổi +73 điểm |
| twenty points and closing | còn 20 điểm và đang khép lại |