Stacked bar — Household spending in four countries, 2024
📄 Bài mẫu band 8–9
| Introduction | Paraphrase: biểu đồ cột chồng tỉ trọng 5 nhóm chi tiêu hộ gia đình ở 4 nước, 2024. |
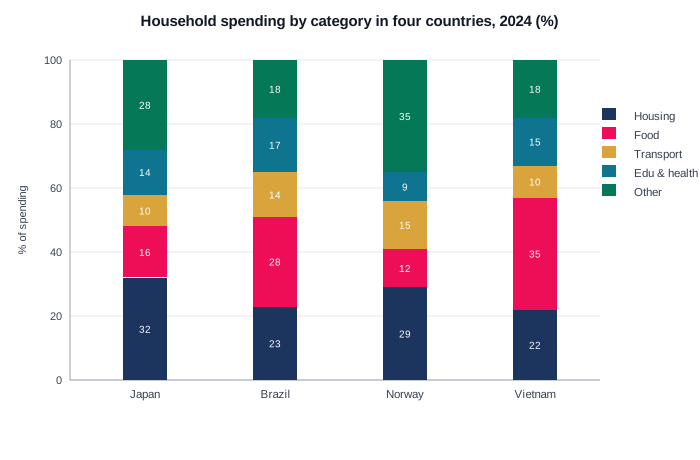
| Overview | Overall: cấu trúc chi tiêu phản ánh mức thu nhập — Việt Nam và Brazil dồn tỉ trọng lớn nhất cho ăn uống (35% và 28%), còn Nhật và Na Uy chi nhiều nhất cho nhà ở hoặc nhóm 'khác'; không nước nào giống nước nào ở nhóm dẫn đầu. |
| Body 1 | Nước thu nhập cao: Nhật — nhà ở 32% lớn nhất, ăn 16%; Na Uy — 'khác' 35% (giải trí, tiết kiệm) lớn nhất, ăn chỉ 12% thấp nhất bảng. |
| Body 2 | Việt Nam: ăn 35% cao nhất bảng, nhà ở 22%; Brazil: ăn 28%, giáo dục+y tế 17% cao nhất bảng — hai nước này để nhóm 'khác' thấp (18%). |
The stacked bar chart compares how households in Japan, Brazil, Norway and Vietnam divided their spending among five categories in 2024.
Overall, the chart splits into two patterns: in the two higher-income countries the biggest single item is housing or discretionary spending, whereas in Brazil and Vietnam it is food that dominates — and each of the four countries has a different category at the top.
Among the wealthier pair, Japanese households devoted 32 per cent to housing, the largest share in their column, with food taking a modest 16 per cent. Norway is the extreme case for discretionary money: 35 per cent went to the ''other'' category and only 12 per cent to food — the lowest food share in the chart — while housing, at 29 per cent, was close behind Japan''s.
The pattern reverses elsewhere. Vietnamese households spent 35 per cent on food, the highest single figure anywhere in the chart, squeezing housing down to 22 per cent. Brazil sat between the extremes, but stood out on education and health, at 17 per cent the largest such share of the four. Transport, notably, was the most uniform category, ranging only from 10 to 15 per cent across all four countries.
| housing or discretionary spending | nhà ở hoặc chi tiêu tuỳ ý |
| food that dominates | ăn uống chiếm áp đảo |
| 32 per cent | 32% |
| 12 per cent to food | 12% cho ăn uống |
| 35 per cent on food | 35% cho ăn uống |
| education and health | giáo dục và y tế |
| most uniform category | nhóm đồng đều nhất |