Mixed — Gym membership and obesity in Westhaven, 2000–2024
📄 Bài mẫu band 8–9
| Introduction | Paraphrase: biểu đồ tỉ lệ người lớn có thẻ gym (cột) và tỉ lệ béo phì (đường) ở Westhaven, 2000–2024. |
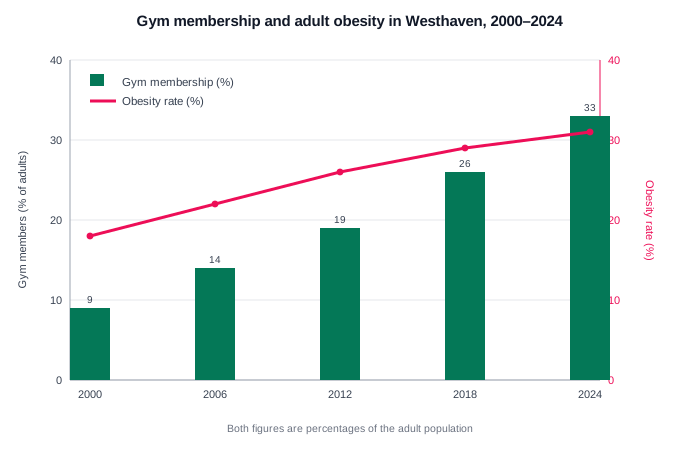
| Overview | Overall: nghịch lý bề mặt — cả hai cùng tăng suốt 24 năm: gym tăng gần gấp 4 (9→33%), béo phì tăng 13 điểm (18→31%); nhưng nhịp khác nhau: gym tăng ngày càng nhanh, béo phì tăng chậm dần. |
| Body 1 | Gym: 9→14→19→26→33, mỗi chặng nhích nhanh hơn chặng trước; 2024 cứ 3 người lớn có 1 thẻ gym. |
| Body 2 | Béo phì: 18→22→26→29→31 — các bước +4,+4,+3,+2 nhỏ dần; hai đường chưa hề giao nhau nhưng khoảng cách từ 9 điểm (2000) chỉ còn −2 điểm (2024 gym vượt). |
The chart plots gym membership (bars) against adult obesity (line) in Westhaven from 2000 to 2024.
Overall, the two series present a surface paradox: both rose across the whole period. Gym membership nearly quadrupled, yet obesity still climbed by 13 percentage points — although a closer look shows obesity''s rise slowing with each interval even as gym membership accelerated.
Membership grew modestly at first, from 9 per cent of adults in 2000 to 14 in 2006, then gathered pace through 19 and 26 to reach 33 per cent in 2024 — one adult in three. Each six-year step was larger than the one before.
Obesity moved the opposite way in rhythm, though not in direction: it rose from 18 to 22, then 26, then 29, and finally 31 per cent, with the increments shrinking from four points to two. In 2000 obesity exceeded membership by nine points; by 2024 membership had overtaken obesity for the first time. What the chart cannot say, of course, is whether one trend influences the other — it records only that Westhaven grew keener on gyms and heavier at the same time, with the second trend now losing momentum.
| a surface paradox | một nghịch lý bề mặt |
| quadrupled | tăng gấp bốn |
| slowing with each interval | chậm dần theo từng chặng |
| 33 per cent in 2024 | 33% năm 2024 |
| 31 per cent | 31% |
| overtaken obesity | vượt qua tỉ lệ béo phì |
| whether one trend influences the other | liệu xu hướng này có tác động xu hướng kia |
| losing momentum | mất đà |