Line — Electricity demand over 24 hours and solar output
📄 Bài mẫu band 8–9
| Introduction | Paraphrase: biểu đồ nhu cầu điện 24h ngày thường vs cuối tuần ở Lumen City, kèm sản lượng điện mặt trời. |
| Overview | Overall: cả hai loại ngày đều có đáy lúc rạng sáng và ĐỈNH LÚC 20:00 — nhưng đỉnh mặt trời lại rơi vào giữa trưa và tắt hẳn trước giờ cao điểm; ngày thường cao hơn cuối tuần ở giờ làm việc, tối cuối tuần vẫn thấp hơn tối ngày thường. |
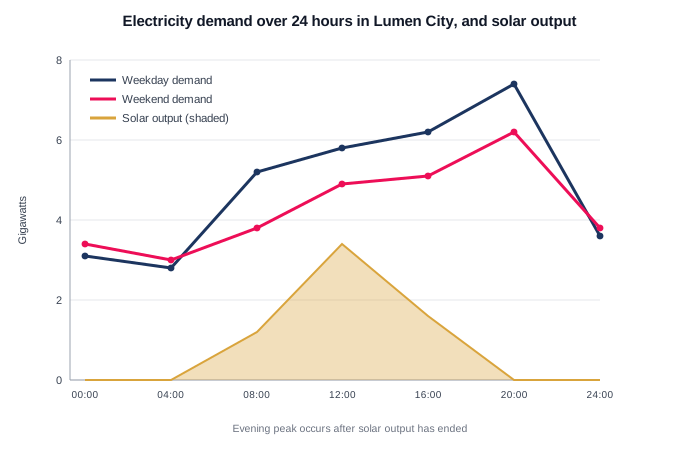
| Body 1 | Nhu cầu: đáy ~2,8–3,0 GW lúc 4h; ngày thường vọt lên 5,2 GW lúc 8h (đi làm) rồi leo dần tới đỉnh 7,4 GW lúc 20h; cuối tuần sáng lười hơn (3,8 GW) nhưng cũng đỉnh 20h ở 6,2 GW. |
| Body 2 | Mặt trời: 0 trước 6h, đỉnh 3,4 GW giữa trưa — bằng ~nửa nhu cầu lúc đó — rồi về 0 trước 20h: đỉnh cầu và đỉnh cung lệch nhau ~8 tiếng, thành phố tối vẫn phải chạy nguồn khác. |
The graph shows how electricity demand in Lumen City varies over a typical day — on weekdays and at weekends — alongside the output of the city''s solar panels.
Overall, both demand curves share the same shape: a pre-dawn trough and an evening peak at around 20:00. Solar output, however, peaks at midday and falls to zero before the evening peak, so the hours when the city wants most power are precisely the hours its panels supply none.
Demand bottoms out at about 2.8–3.0 gigawatts at 04:00 on both kinds of day. On weekdays it then jumps to 5.2 GW by 08:00 as work begins, climbs gently through the afternoon, and crowns at 7.4 GW at 20:00. The weekend curve rises later and more lazily — only 3.8 GW at 08:00 — but it too peaks at 20:00, at 6.2 GW, before both curves fall away towards midnight.
Solar output traces a completely different rhythm: nothing before 06:00, a midday peak of 3.4 GW — roughly half of demand at that hour — and nothing again after 19:00. The eight-hour mismatch between the supply peak and the demand peak is the chart''s central message: whatever powers Lumen City''s evenings, it is not sunshine.
| pre-dawn trough | đáy lúc rạng sáng |
| around 20:00 | khoảng 20 giờ |
| falls to zero before the evening peak | về 0 trước đỉnh buổi tối |
| supply none | không cấp được gì |
| 7.4 GW at 20:00 | 7,4 GW lúc 20h |
| 6.2 GW | 6,2 GW |
| 3.4 GW | 3,4 GW |
| eight-hour mismatch | độ lệch 8 tiếng |
| it is not sunshine | không phải là ánh nắng |