Line — Air pollutants in Grenchester, 2005–2025
📄 Bài mẫu band 8–9
| Introduction | Paraphrase: biểu đồ nồng độ 3 chất ô nhiễm ở Grenchester 2005–2025; vùng không khí sạch áp dụng 2017. |
| Overview | Overall: hai chất từ giao thông (NO2, bụi PM2.5) giảm suốt kỳ và giảm GẤP sau mốc 2017; ozone ngược dòng — tăng chậm, đều đặn cả kỳ; đến 2025 khoảng cách giữa chất bẩn nhất và sạch nhất thu hẹp mạnh. |
| Body 1 | NO2: 52 → 44 (2015) — mỗi 5 năm giảm ~4; sau CAZ: 30 (2020), 22 (2025) — tốc độ giảm gấp đôi; PM2.5 cùng dạng: 38 → 33 rồi lao về 19. |
| Body 2 | Ozone: 24 → 33, tăng ~2 điểm mỗi 5 năm, không phản ứng với mốc 2017; 2025 ozone (33) đã VƯỢT NO2 (22) — đảo thứ hạng so với 2005. |
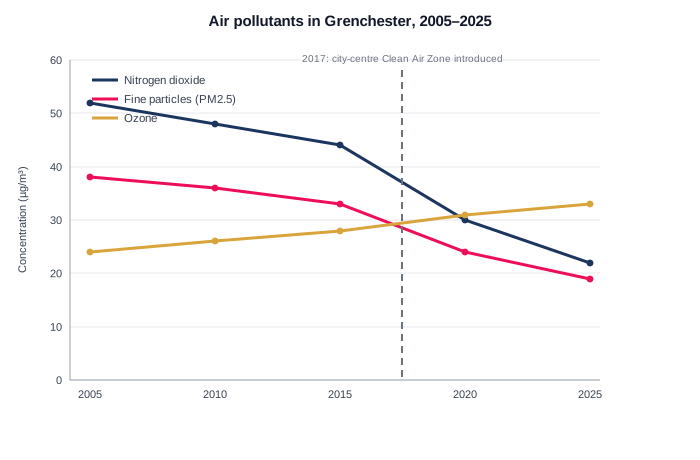
The graph tracks three air pollutants in Grenchester from 2005 to 2025, with a marker showing the introduction of a city-centre Clean Air Zone in 2017.
Overall, the two traffic-related pollutants — nitrogen dioxide and fine particles — fell throughout the period, and their decline visibly steepened after 2017. Ozone moved in the opposite direction, rising slowly but relentlessly, so that by 2025 the city''s cleanest and dirtiest measures had traded places.
Nitrogen dioxide fell gently at first, from 52 to 44 micrograms between 2005 and 2015 — roughly four micrograms per five-year step. After the zone was introduced, the drops doubled in size: to 30 by 2020 and 22 by 2025. Fine particles followed the same shape, easing from 38 to 33 before plunging to 19 over the final decade.
Ozone ignored both the trend and the policy. It climbed steadily from 24 to 33 micrograms, gaining about two points every five years, with no visible response to the 2017 marker. The result is a quiet reversal: in 2005 ozone was the least concentrated of the three pollutants, but by 2025 it had overtaken nitrogen dioxide — a reminder that the zone addressed traffic fumes, not every pollutant in the city''s air.
| visibly steepened | dốc hơn thấy rõ |
| in the opposite direction | theo chiều ngược lại |
| traded places | đổi chỗ cho nhau |
| four micrograms per five-year step | 4 µg mỗi chặng 5 năm |
| 22 by 2025 | còn 22 vào 2025 |
| plunging to 19 | lao xuống 19 |
| 33 micrograms | 33 µg |
| no visible response | không phản ứng thấy được |
| overtaken nitrogen dioxide | vượt qua NO2 |
| not every pollutant | không phải mọi chất ô nhiễm |