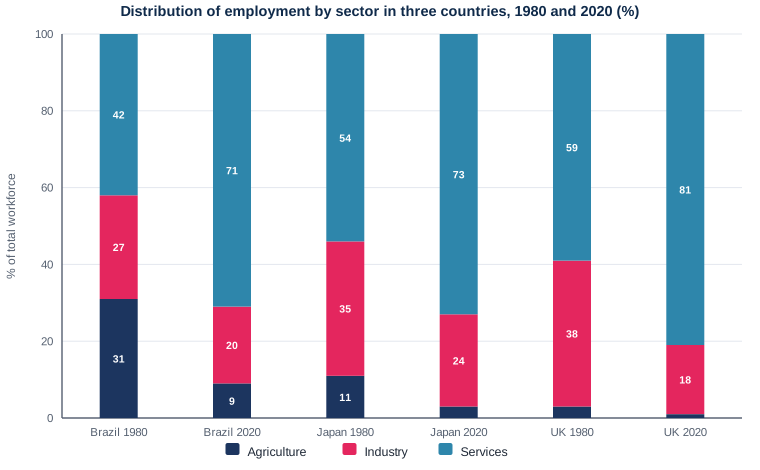
Bar chart — Employment by sector in three countries, 1980 and 2020
📄 Bài mẫu band 8–9
| Introduction | Paraphrase: cơ cấu lao động theo 3 ngành ở 3 quốc gia, năm 1980 và 2020. |
| Overview | Overall: cả ba nước đều dịch chuyển lao động sang khu vực dịch vụ, trong khi nông nghiệp và công nghiệp cùng co lại; Brazil thay đổi mạnh nhất. Không số liệu. |
| Body 1 | Nông nghiệp: Brazil 31% → 9%, Nhật 11% → 3%, Anh 3% → 1%. Công nghiệp: Anh 38% → 18%, Nhật 35% → 24%, Brazil 27% → 20%. |
| Body 2 | Dịch vụ: Anh 59% → 81% (cao nhất), Nhật 54% → 73%, Brazil 42% → 71% (tăng mạnh nhất, 29 điểm). |
The bar chart compares the proportion of workers employed in agriculture, industry and services in Brazil, Japan and the United Kingdom in 1980 and 2020.
Overall, all three economies moved in the same direction, with services expanding to account for a far larger share of employment in each case. Agriculture and industry contracted everywhere, and the change was most dramatic in Brazil.
Agriculture shrank in every country, though from very different starting points. Almost a third of Brazilian workers were employed on the land in 1980, at 31%, but this had fallen to 9% by 2020. Japan saw a similar proportional decline, from 11% to 3%, while British agriculture, already tiny at 3%, dwindled to just 1%. Industry contracted as well, most sharply in the UK, where its share halved from 38% to 18%.
Services absorbed the workers released by both sectors. The British figure was the highest at each date, climbing from 59% to 81%, and Japan rose from 54% to 73%. The most dramatic shift occurred in Brazil, where services swelled by 29 percentage points, from 42% to 71%, almost catching up with Japan despite starting far behind.
| expanding to account for | mở rộng để chiếm tỷ trọng |
| had fallen to | đã giảm xuống còn |
| dwindled to | teo lại còn |
| contracted | co lại |
| The most dramatic shift | sự dịch chuyển mạnh nhất |
| swelled by | phình thêm |