Viết theo công thức của thầy Châu Cát Tường · 8.5 Writing
FREE Bài mẫu IELTS Writing band 8–9
← Tất cả bài mẫu

Band 8.5 — Line Graph: Commuting by Car, Bus and Bicycle (1990–2020)
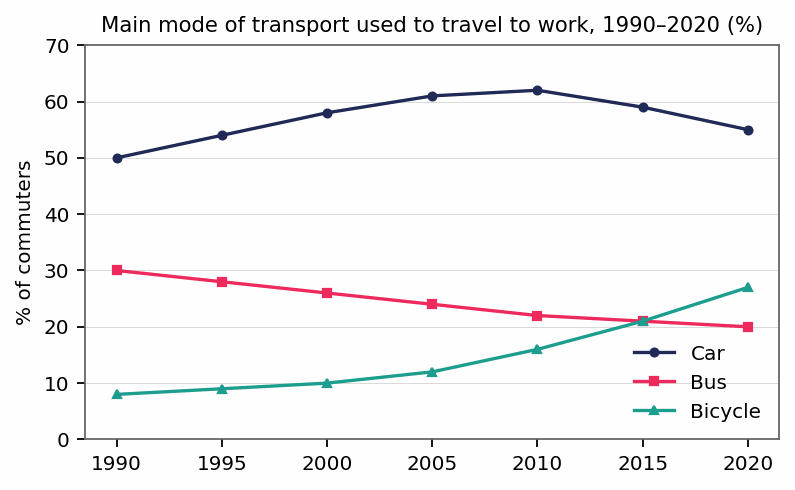
The line graph below shows the percentage of commuters using three modes of transport (car, bus and bicycle) to travel to work in one European city between 1990 and 2020. Summarise the information by selecting and reporting the main features, and make comparisons where relevant.
Biểu đồ đề bài — Band 8.5 — Line Graph: Commuting by Car, Bus and Bicycle (1990–2020)

📄 Bài mẫu band 8.5

Writing Task 1 · 169 từ — viết theo đúng công thức 8020 của thầy Châu Cát Tường. Từ & cụm ăn điểm được tô sáng ngay trong bài.
Bài mẫu

The line graph illustrates the percentage of commuters who travelled to work by car, bus and bicycle in a European city across the three decades from 1990 to 2020.

Overall, the car remained the most widely used mode throughout the period, despite losing ground towards the end, whereas cycling rose steadily and eventually overtook the declining bus.

In 1990, half of all commuters relied on cars, a figure which climbed gradually to peak at 62% in 2010. Thereafter, car use went into decline, slipping back to 55% by the end of the period. Bus travel, by contrast, followed a consistently downward path, falling from 30% in 1990 to just 20% three decades later.

Cycling presented a markedly different trend. Having accounted for a mere 8% of journeys in 1990, it crept up to 16% in 2010 before accelerating sharply to reach 27% by 2020. This represented more than a threefold rise over the period and, notably, left cycling well above the figure for buses, which it had already surpassed.

169 từ
Phân tích: Bài đạt band 8.5 nhờ cách nhóm dữ liệu thông minh: hai xu hướng giảm (car cuối kỳ + bus) và một xu hướng tăng (bicycle) được tách đoạn hợp lý thay vì tả lần lượt. Overview nêu đúng hai đặc điểm chính mà không kèm số. Các cấu trúc cao cấp: mệnh đề quan hệ a figure which climbed gradually, phân từ hoàn thành Having accounted for a mere 8%, và mệnh đề quan hệ rút gọn which it had already surpassed. Collocation mô tả số liệu chính xác: peak at 62%, went into decline, crept up, more than a threefold rise.
Toàn bộ bài mẫu ở đây miễn phí — không cần đăng nhập
Có tài khoản thì thêm được: AI chấm bài bạn tự viết theo 4 tiêu chí band descriptors, lưu bài mẫu vào Sổ tay, và theo dõi lỗi hay sai của riêng bạn. Mất 10 giây, không cần thẻ.