Viết theo công thức của thầy Châu Cát Tường · 8.5 Writing
FREE Bài mẫu IELTS Writing band 8–9
← Tất cả bài mẫu

Band 8.0 — Line Graph: Average Monthly Temperatures in London, Dubai and Sydney
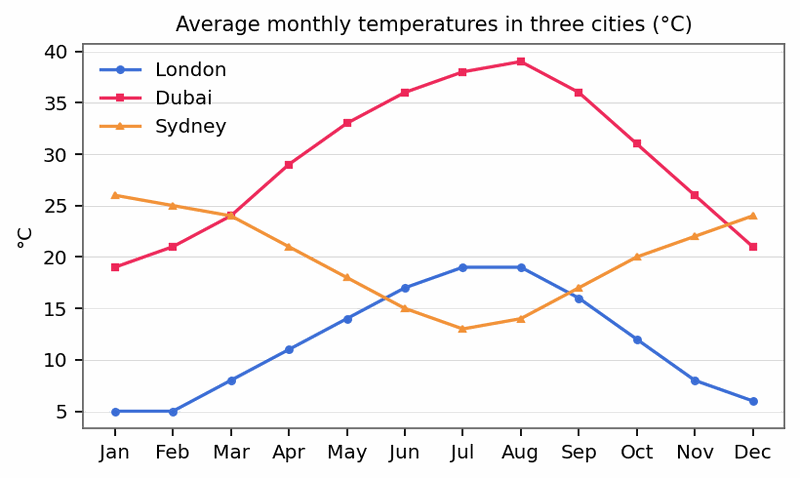
The line graph below shows the average monthly temperatures, in degrees Celsius, in three cities (London, Dubai and Sydney) over one year. Summarise the information by selecting and reporting the main features, and make comparisons where relevant.
Biểu đồ đề bài — Band 8.0 — Line Graph: Average Monthly Temperatures in London, Dubai and Sydney

📄 Bài mẫu band 8.0

Writing Task 1 · 168 từ — viết theo đúng công thức 8020 của thầy Châu Cát Tường. Từ & cụm ăn điểm được tô sáng ngay trong bài.
Bài mẫu

The line graph compares the average monthly temperatures, measured in degrees Celsius, recorded in London, Dubai and Sydney over the course of a single year.

Overall, Dubai was consistently the hottest of the three cities, while London remained the coolest for most of the year. The two northern-hemisphere cities shared the same seasonal rhythm, peaking in mid-year, whereas Sydney followed the opposite pattern.

Temperatures in Dubai began at 19°C in January and rose steeply to peak at 39°C in August, before falling back to 21°C by December. London traced a similar but far gentler curve: starting at a chilly 5°C, it reached a high of 19°C in July and August—less than half Dubai's maximum—and then declined to 6°C at the year's end.

Sydney, by contrast, displayed a reverse trend, reflecting its southern-hemisphere location. Its warmest month was January, at 26°C, after which temperatures fell steadily to a low of 13°C in July, precisely when the other two cities were at their hottest, before recovering to 24°C in December.

168 từ
Phân tích: Bài band 8.0 xử lý dữ liệu chu kỳ 12 tháng bằng cách chỉ chọn đỉnh, đáy và mốc đầu–cuối, tránh liệt kê cả 12 con số. Cấu trúc cao cấp: phân từ hiện tại reflecting its southern-hemisphere location, so sánh giản lược less than half Dubai's maximum thay cho việc lặp số, và mệnh đề trạng ngữ thời gian precisely when the other two cities were at their hottest. Collocation đắt: rose steeply to peak at, traced a similar but far gentler curve, fell steadily to a low of.
Toàn bộ bài mẫu ở đây miễn phí — không cần đăng nhập
Có tài khoản thì thêm được: AI chấm bài bạn tự viết theo 4 tiêu chí band descriptors, lưu bài mẫu vào Sổ tay, và theo dõi lỗi hay sai của riêng bạn. Mất 10 giây, không cần thẻ.