Band 7.5 — Line Graph: Monthly Cinema Attendance by Age Group (2000–2020)
📄 Bài mẫu band 7.5
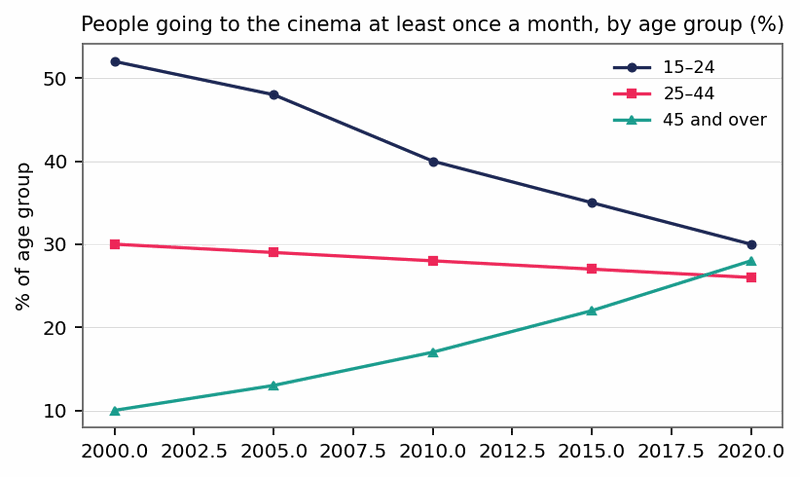
The line graph shows the percentage of people in three age groups who went to the cinema at least once a month in one country between 2000 and 2020.
Overall, monthly cinema-going fell sharply among the youngest group, while the opposite was true of those aged 45 and over. By the end of the period, the gap separating the three groups had narrowed considerably.
In 2000, people aged 15–24 were by far the keenest cinema-goers, with just over half attending monthly. This figure, however, fell steadily throughout, dropping to 40% in 2010 and reaching a low of 30% in 2020. Attendance among 25–44-year-olds proved far more stable, slipping only marginally from 30% to 26% across the two decades.
The oldest group followed the reverse trend. Whereas only one in ten people over 45 attended regularly in 2000, this proportion nearly tripled to 28% by 2020, almost overtaking the youngest group. As a result, the three groups, once widely separated, ended the period at broadly comparable levels.